 Aero Sync

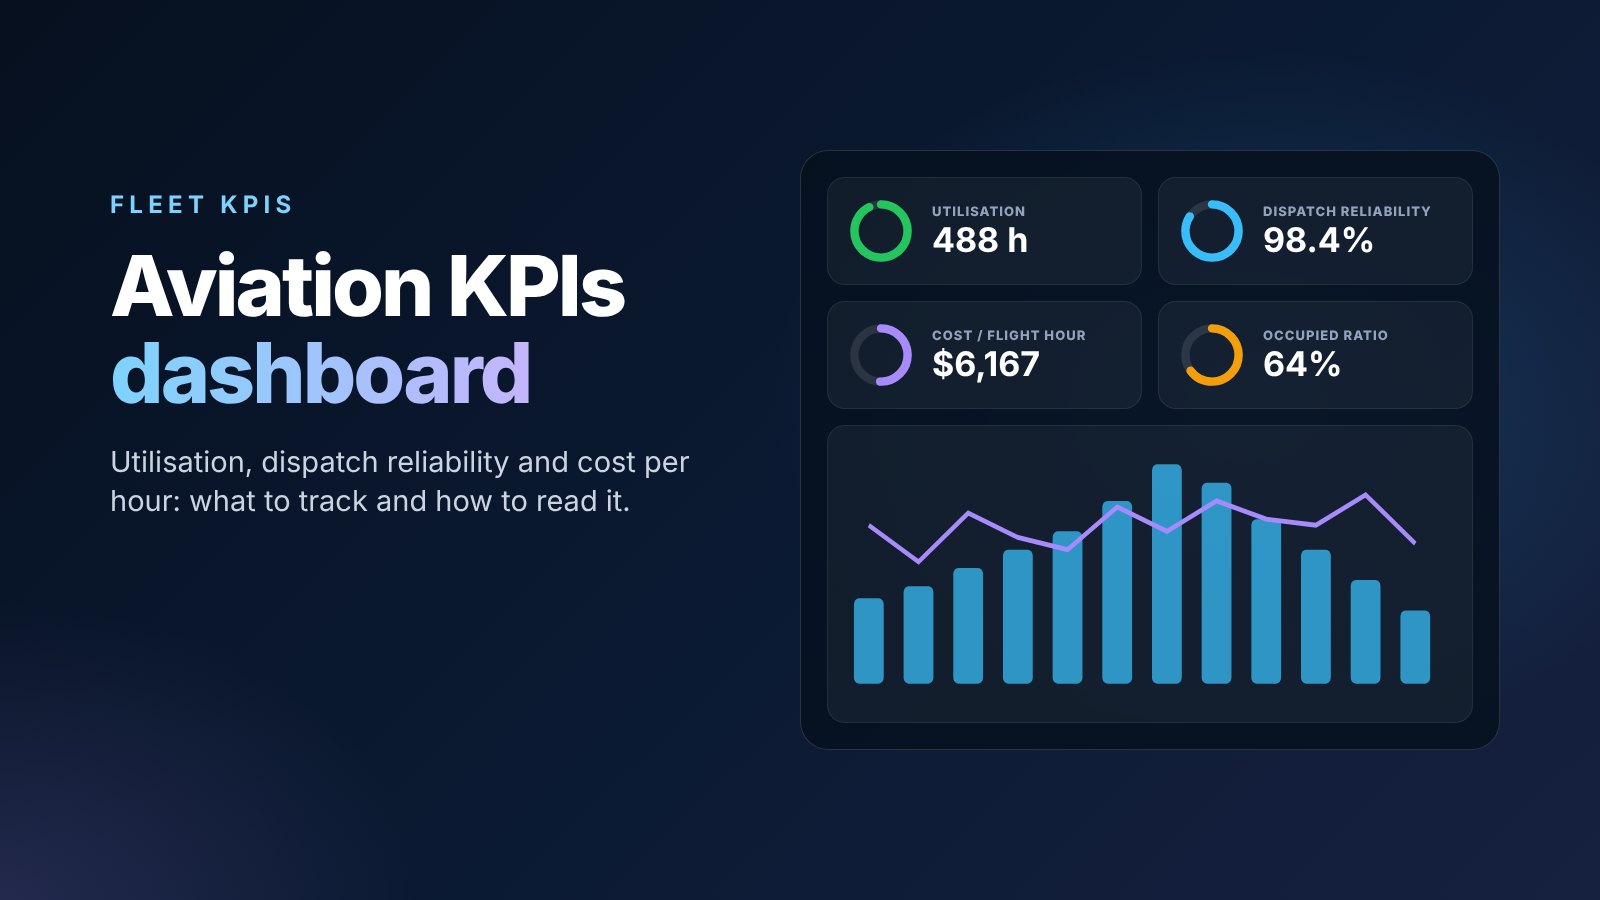
An aviation KPIs dashboard turns a year of flight logs, maintenance records and invoices into a handful of numbers that show whether a fleet is healthy. For business aviation operators the three that matter most are utilisation, dispatch reliability and cost per flight hour. On their own, though, they can mislead. This guide defines the fleet key performance indicators (KPIs) every operator should track, shows how they connect, explains the calculation traps that make two operators' "98%" mean different things, and suggests how to design a dashboard people actually use.
The interactive KPI dashboard below lets you load a sample charter fleet, a corporate flight department or a mixed fleet, edit the data, run what-if scenarios and drill down into each aircraft.
Scope: fleet figures in this article and the dashboard are illustrative. Definitions vary between operators, manufacturers and lessors, so always state the definition next to the number.
Why fleet KPIs matter more than ever
Business aviation has become a high-utilisation industry. Aviation Week reported that NetJets alone flew just over 200,000 hours in Q1 2026, about 71% more than in the same quarter of 2019. Larger fleets, tighter crew supply and rising costs mean margins depend on small operational differences: a few more technical delays, a few more positioning legs or a few fewer hours per aircraft can turn a profitable year into a loss.
KPIs make those differences visible early. A good dashboard answers three questions every week: are we flying the aircraft enough, are we flying them reliably, and is each hour profitable?
Leading and lagging indicators
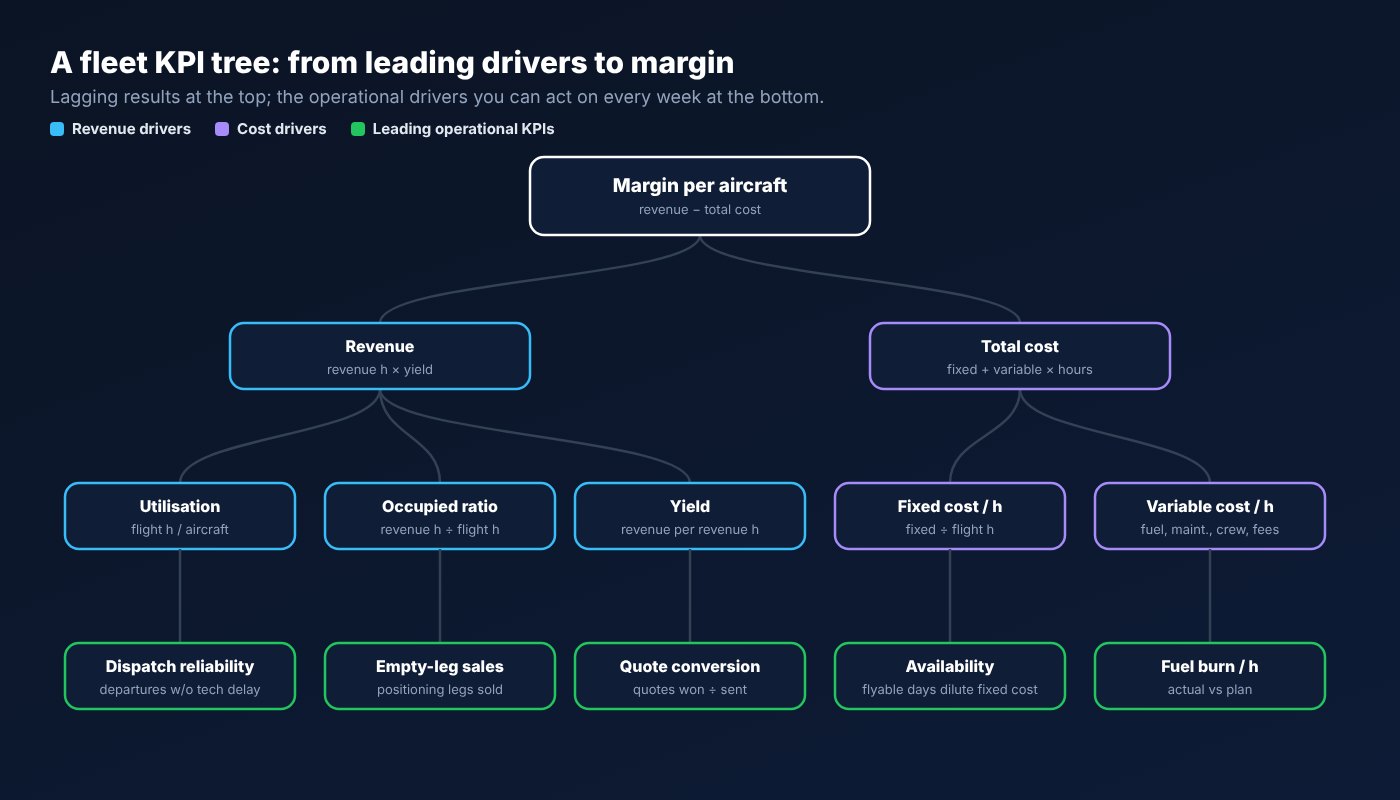
Lagging indicators measure results after the fact: margin, cost per hour, annual utilisation. Leading indicators measure the drivers you can still change: dispatch reliability, availability, quote conversion, empty-leg sales and fuel burn against plan. A useful aviation KPIs dashboard puts both on the same screen and shows how they connect.
The core fleet KPIs, defined
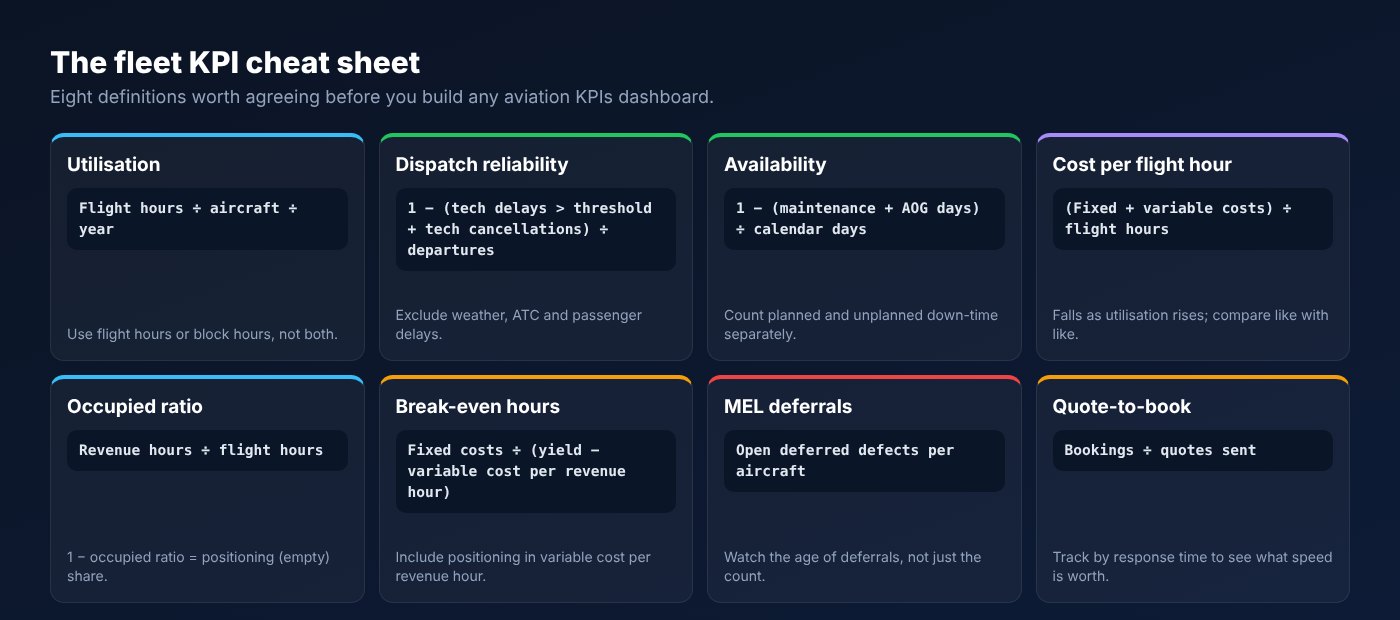
1. Utilisation
Utilisation is flight hours per aircraft per period, usually per year. It drives everything else, because most of an aircraft's cost is fixed: crew salaries, insurance, hangar, training, financing and depreciation. Twice the hours roughly halves the fixed cost per hour.
The traps: some operators count block hours (chocks off to chocks on), others flight hours (take-off to landing), and the difference is typically 0.1 to 0.3 hours per sector. Short-sector fleets also look worse on hours but better on departures. Track both hours and cycles, and report utilisation per available day so that aircraft in heavy maintenance do not hide the performance of the rest.
2. Dispatch reliability
Dispatch reliability measures the share of departures that leave without a technical delay or cancellation. A simple formula is: 1 − (technical delays above the threshold + technical cancellations) ÷ scheduled departures. The threshold matters. A guide to measuring despatch reliability notes that margins range from 15 minutes for scheduled and charter operators to one hour for corporate operators, and that non-aircraft causes such as weather, air traffic control and security are excluded.
Two operators can report "98.5%" with very different performance if one uses 15 minutes and the other 60. The dashboard below lets you switch thresholds to see the effect. Also note what the KPI hides: an aircraft that dispatches under a minimum equipment list (MEL) deferral counts as reliable even if the passengers lose a feature. That is why MEL deferrals deserve their own KPI. SKYbrary's MEL overview explains how deferrals work.
3. Availability
Availability is the share of calendar days the aircraft is not in maintenance or aircraft on ground (AOG). Separate planned maintenance from unplanned downtime: planned days can be scheduled into quiet months, unplanned days destroy trips and reputation.
4. Cost per flight hour
Cost per flight hour (CPH) = (fixed costs + variable costs) ÷ flight hours. Variable costs are fuel, maintenance reserves and engine programs, crew expenses, landing, handling, navigation and catering. Fixed costs are everything you pay whether or not the aircraft flies. Always show the split, because the two halves respond to completely different actions: variable cost falls with better fuel buying and planning; fixed cost per hour falls only with more hours.
5. Occupied ratio and positioning share
The occupied ratio is revenue (or passenger) hours divided by flight hours. One minus the ratio is the positioning share, the "empty legs". Industry commentary often quotes figures such as around 40% of private jet flights being empty return legs. Every point of occupied ratio gained is revenue without extra fixed cost.
6. Yield, break-even and margin
Yield is revenue per revenue hour. Break-even hours per aircraft = fixed costs ÷ (yield − variable cost per revenue hour), where variable cost per revenue hour includes the positioning hours needed to fly each revenue hour. Comparing actual revenue hours with break-even is the single clearest profitability signal for a charter aircraft.
Interactive aviation KPIs dashboard
Load one of the three sample fleets, then use the what-if sliders to fly more or fewer hours or cut technical delays, and watch every KPI and its change from the baseline. Click an aircraft scorecard, or a dot on the cost-per-hour chart, to drill down to that tail. Open "Edit fleet data" to enter your own annual figures; the dashboard recalculates instantly.
Things to notice: in the charter fleet, the fourth aircraft has the lowest utilisation and the most maintenance days, so its cost per hour is well above the others and it sits below break-even. Increasing hours by 20% improves every financial KPI, but notice that fixed cost per hour falls faster than variable cost. Switch the delay threshold from 15 to 60 minutes and dispatch reliability jumps without anything changing on the ramp.
Finding the causes behind dispatch reliability
A dispatch reliability number tells you that you have a problem, not where. The standard way to find causes is to code every technical delay and cancellation by ATA chapter, the industry numbering system for aircraft systems described in the ATA 100 standard, then sort by frequency.
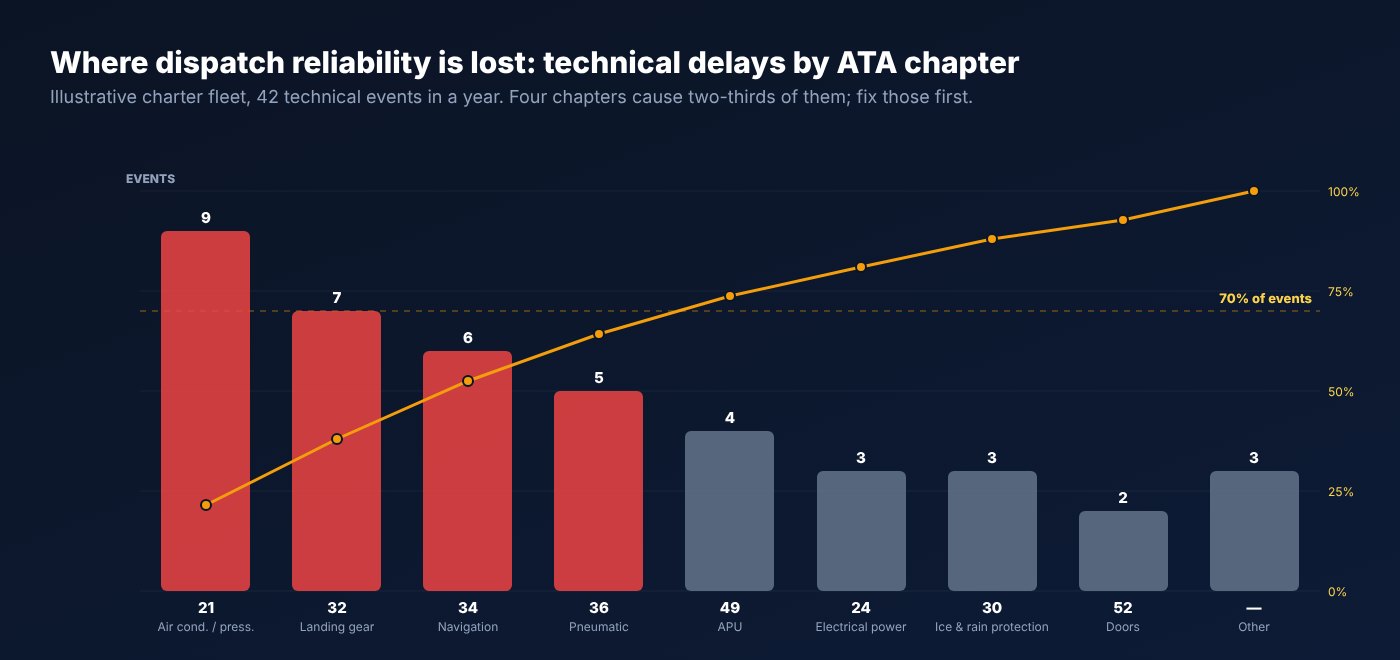
The Pareto view usually shows that a few chapters cause most events. From there, the reliability programme asks the deeper questions: is it one part number repeating (a rogue unit), one tail, one base, or one maintenance task done differently? Metrics such as mean time between unscheduled removals (MTBUR) for key components and repeat-defect rates belong on the maintenance tab of the dashboard.
Dispatch reliability is a result. Repeat defects, deferral age and parts lead times are the levers.
Seasonality, benchmarks and fair comparisons
Monthly KPIs move with the season. A European operator based at Bern (LSZB) peaks in summer; a US operator flying Scottsdale (KSDL) to Fort Lauderdale Executive (KFXE) peaks in winter. Compare each month with the same month last year, or use rolling 12-month figures, rather than month-on-month changes.
Comparisons between aircraft also need care:
- Different missions: a light jet doing short hops between Bern and Munich (EDDM) will show more departures, more cycles and higher cost per hour than a large-cabin jet on long legs. Compare cost per trip or cost per seat-mile as well.
- Different ages: older aircraft carry higher maintenance cost but lower ownership cost. Show both.
- Different ownership: managed aircraft have owner-paid fixed costs; on a charter dashboard, track the operator's own margin per hour separately from the owner's cost.
Commercial, crew and safety KPIs to add next
Once the core six are stable, extend the aviation KPIs dashboard into the areas that drive them. Keep each one tied to a decision someone will actually make.
- Quote response time and quote-to-book ratio: how quickly sales answers a charter request and what share becomes a booking. Charter buyers often book the first credible quote, so response time is a leading indicator of utilisation.
- Empty-leg sell rate: the share of positioning legs sold, even at a discount. It directly lifts the occupied ratio and margin without adding fixed cost.
- Crew duty utilisation: flight duty hours used against those available under your flight time limitations. Low values point to over-staffing or poor rostering; values close to the limits point to fatigue risk and lost flexibility.
- Training and currency compliance: the share of crew current on every check, and days until the next expiry. A lapsed check can ground a crew member, and therefore an aircraft, as surely as a defect.
- Fuel burn against plan: actual burn compared with the flight plan per sector, which reveals tankering decisions, routing differences and weight creep.
- Safety indicators: safety reports per 1,000 hours, unstable approaches per 100 sectors and the number of flights flagged by your flight risk assessment tool (FRAT). These belong next to commercial KPIs so pressure to improve reliability or utilisation never hides a rising risk.
- Customer experience: on-time departure against the customer's requested time, not just technical dispatch, plus complaint and repeat-booking rates.
A practical layout is three tabs: Operations (utilisation, availability, dispatch reliability, MEL deferrals), Commercial (occupied ratio, yield, quote conversion, margin) and Safety and crew (reports, FRAT flags, duty use, training currency). Everyone sees the same headline tiles; each owner drills into their own tab.
How to design a dashboard people actually use
- Start with five to eight KPIs. More tiles mean less attention. Utilisation, dispatch reliability, availability, cost per hour, occupied ratio and break-even cover most needs.
- Set targets and colour by status. Red, amber and green against a written target make the screen readable in seconds. The sample dashboard turns amber within 10% of target.
- Show the trend, not just the number. A 12-month chart beside each KPI shows whether a red number is improving.
- Allow drill-down. Fleet, then aircraft, then event. Most insight comes from the outlier aircraft, not the average.
- Automate the data. If someone has to type the numbers each month, the dashboard dies. Feed it from the logbook, maintenance tracking and accounting systems.
- Review it in a fixed meeting. A 30-minute monthly KPI review with operations, maintenance and sales, ending with owners and dates for actions.
One owner per KPI: give each KPI a named owner. Dispatch reliability to the maintenance manager, occupied ratio to sales, cost per hour to finance. Shared KPIs drift.
Common KPI mistakes
- Mixing block and flight hours across aircraft or months.
- Averaging percentages instead of recalculating from totals. Fleet dispatch reliability must be computed from total departures, not the average of each aircraft's percentage.
- Counting only delays, not cancellations, which hides the worst events.
- Ignoring positioning in cost per revenue hour, which overstates margin.
- Reporting cost per hour without utilisation, so a fall in cost per hour looks like cost control when it is just more flying.
- No definitions on the dashboard, so every reader interprets the numbers differently.
Beware perverse incentives: a dispatch reliability target can pressure crews and engineers to dispatch with questionable defects. Pair reliability KPIs with safety indicators and a reporting culture that protects people who say "no-go".
Key takeaways
- A good aviation KPIs dashboard combines lagging results (margin, cost per hour) with leading drivers (dispatch reliability, availability, occupied ratio).
- Utilisation dilutes fixed cost; show cost per hour split into fixed and variable.
- Always state definitions: block versus flight hours and the delay threshold change the numbers.
- Find reliability causes with a Pareto by ATA chapter, repeat defects and deferral age.
- Keep it to five to eight KPIs, with targets, trends, drill-down and an owner for each.
Track your fleet in Aero Sync
Aero Sync's Fleet Analytics area starts with My Fleet: your aircraft with their own specifications, a digital flight logbook and utilisation insight, so the numbers behind your KPIs come from the flights you actually log.
Frequently asked questions
What KPIs should an aviation operator track?
At minimum utilisation, dispatch reliability, availability, cost per flight hour, occupied ratio and margin or break-even per aircraft, plus safety indicators from the SMS.
What is an aviation KPIs dashboard?
A single screen that shows a fleet's key performance indicators against targets, with trends and drill-down by aircraft, fed automatically from operational and financial data.
How is aircraft utilisation calculated?
Flight hours (or block hours) flown per aircraft over a period, usually a year. State which hour definition you use.
How is dispatch reliability calculated?
One minus the number of technical delays above a threshold plus technical cancellations, divided by scheduled departures. Weather, ATC and passenger delays are excluded.
What delay threshold should I use?
Charter and scheduled operators commonly use 15 minutes; corporate flight departments often use 60 minutes. Choose one and keep it consistent.
What is a good dispatch reliability for business jets?
Many operators target 98 to 99.5%, but the figure depends on the threshold and fleet age. Compare against your own trend and the manufacturer's fleet data.
How do I calculate cost per flight hour?
Add fixed and variable costs for the period and divide by flight hours. Show the fixed and variable parts separately.
Why does cost per hour fall when utilisation rises?
Because fixed costs are spread over more hours. Variable cost per hour stays roughly the same.
What is the occupied ratio?
Revenue or passenger hours divided by total flight hours. The rest is positioning or empty flying.
How do I calculate break-even hours for a charter aircraft?
Divide fixed costs by the difference between revenue per revenue hour and variable cost per revenue hour, including positioning.
What is the difference between leading and lagging KPIs?
Lagging KPIs show results, such as margin. Leading KPIs show drivers you can still influence, such as dispatch reliability and quote conversion.
What is an ATA chapter?
A standard number for an aircraft system, such as 21 for air conditioning or 32 for landing gear, used to code defects and delays.
How often should fleet KPIs be reviewed?
Operational KPIs weekly, and the full dashboard in a monthly review with owners and actions, using rolling 12-month figures for trends.
Should fleet dispatch reliability be an average of each aircraft?
No. Recalculate from fleet totals, otherwise aircraft with few departures carry too much weight.